We investigated the prevalence and risk factors for SARS-CoV-2 infection, which included occupational exposure to SARS-CoV-2, inadequate IPC training, insufficient use of PPE at work, performing aerosol-generating procedures, hygiene measures, quarantine and household exposure.
Study selection
We used Covidence to streamline the production of the systematic review (Covidence systematic review software, Veritas Health Innovation, Melbourne, Australia. Available at www.covidence.org). The search from three databases (MEDLINE, Embase and Google Scholar) yielded a total of 498 studies, of which 370 studies were screened through titles and abstracts (Fig. 1). A total of 190 studies were thoroughly reviewed in full text. Of these, 63 studies met the inclusion criteria and were included in these meta-analyses (see summary of each study in Supplementary Table 5). Data from these studies were collected during December 2019 to December 2021.
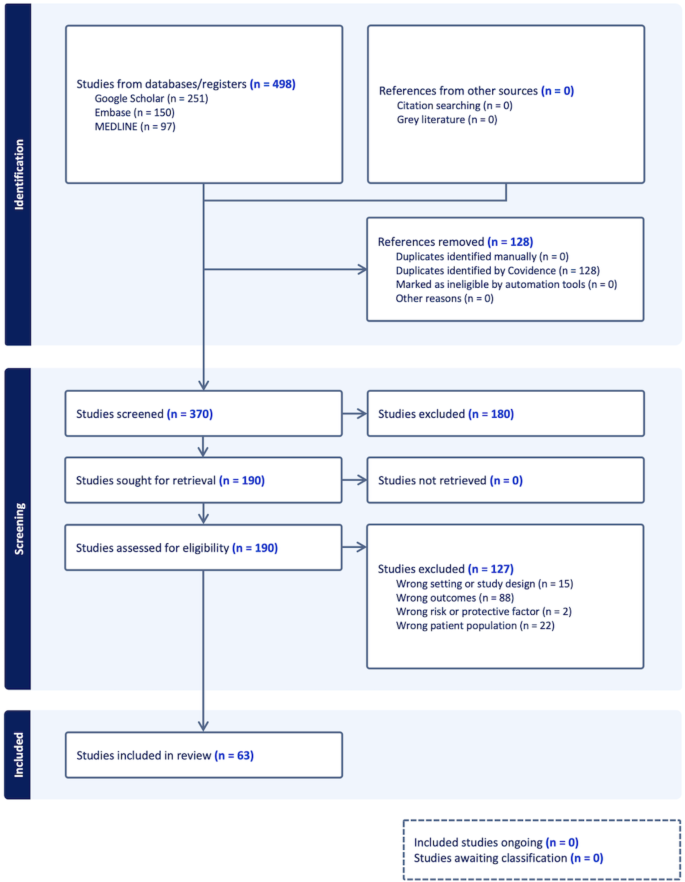
PRISMA Flow Diagram for selection of the studies in systematic review and meta-analysis. Figure was created using Covidence. Covidence is a web-based collaboration software platform that streamlines the production of systematic and other literature reviews. This study aimed to identify key risk and protective factors associated with SARS-CoV-2 infection among healthcare workers (HCWs). The included quantitative studies were published between 1 December 2019 and 5 February 2024 and investigated the association between risk factors and SARS-CoV-2 infection in HCWs. Three electronic databases, MEDLINE, Embase, and Google Scholar, were searched. Inclusion criteria restricted the search to studies involving human participants, published in English, and of specific article types (clinical trials, observational studies, letters, and case reports) (See Table 1 for details). Studies excluded due to “wrong setting” encompassed those with irrelevant characteristics or inappropriate design. The primary outcome measure was SARS-CoV-2 infection, confirmed by either a positive Reverse Transcription Polymerase Chain Reaction (RT-PCR) test, nucleoprotein seropositivity, or spike-protein seropositivity in unvaccinated individuals.
SARS-CoV-2 infection rates
All the included studies predominantly focused on HCWs without prior infection or those with a likely primary infection, as opposed to those with breakthrough infection. The SARS-CoV-2 infection rates in HCWs varied widely (ranging between 1 and 59%) in different parts of the world with different transmission settings7,9,28. SARS-CoV-2 infection rates with 95% CI among HCWs were reported from 27 countries (Fig. 2). Here, SARS-CoV-2 infection refers to laboratory-confirmed cases, diagnosed through either RT-PCR or serological testing. Globally, SARS-CoV-2 infection rate of 11% (95% CI 9–13%; I2 = 100%, high heterogeneity) was found among 283,932 HCWs (Table 1). Since the high heterogeneity between studies could be due to the different infection rates when VOCs involved, we performed a subgroup analysis of infection rate according to the major circulating strains. Majority of included studies (55/63) were conducted between December 2019 and January 2021 (262,306 HCWs), when the ancestral strain circulated. Six studies collected data up to May 2021 (20,411 HCWs), when the alpha VOC emerged and became predominant. Only 2 studies collected data up to December 2021 (1,215 HCWs), when the delta VOC presented and became predominant. SARS-CoV-2 infection rates among HCWs increased from 9% when the ancestral strain was solely presented to 26% and 22% when the alpha and delta strains emerged. The difference in infection rates between subgroups was statistically significant (p < 0.001), suggesting that the appearance of VOCs increased the risk of infection among HCWs. However, since far more studies (and participants) contribute data to the ancestral subgroup than to the ancestral and alpha subgroup or ancestral, alpha and delta VOC sub-group, these results should be interpreted with caution. We found a wider range of infection rates in the USA29,30 (1–35%) and India31,32 (5–20%) in 2020–21. The highest infection rates among HCWs reported in Mexico9 was 59% (95% CI 49–68%) during August 2020–January 2021, 43% (95% CI 40–46%) in Poland33 in January 2021, and 41% (95% CI 36–47%) in the Democratic Republic of the Congo (DRC)8 during July–August 2020. In contrast, Australia34, Germany35, Japan36 and Switzerland37 had the lowest SARS-CoV-2 infection rates (< 2%) in 2020. We conducted additional subgroup analyses based on geography and study design to identify key contributors to heterogeneity (Supplementary Figs. 2 and 3). The infection rates were significantly impacted by regions: 27% (95% CI 15–45%) in Africa, 12% (95% CI 8–17%) in Asia, 10% (95% CI 8–14%) in Europe, 9% (95% CI 6–13%) in North America, 1% (95% CI 0–4%) in Oceania, and 1% (95% CI 0–4%) in South America (Supplementary Fig. 2). Additionally, infection rates differed by study design, although not significantly; 22% (95% CI 9–44%) for case–control studies, 8% (95% CI 6–11%) for cohort studies and 11% (95% CI 8–13%) for cross-sectional studies (Supplementary Fig. 3). The heterogeneity was high for all subgroup analyses, suggesting multiple contributing risk factors. Publication bias was implied in both funnel and Doi plots (LFK index = − 2; Supplementary Fig. 4a,b). Despite potential evidence of publication bias, visual asymmetry in the funnel plot and false positive LFK index may also arise from small study effects and/or true heterogeneity between the included studies38,39. As this list of studies demonstrates, there is a significant over-representation of research from high-income nations. There is limited data from South America, Africa, and the Middle East, which is likely related to inadequate surveillance in less developed countries and linguistic barriers. In order to obtain LFK index within acceptable limits, we removed 7 studies based on high standard error of effect estimate (Supplementary Fig. 4c–e). In this subset analyses, the overall infection rate remains comparable for the alpha and delta variants. However, it is 2% higher for the ancestral strain or when subgroup analysis is not performed. The SARS-CoV-2 infection rate among HCWs was estimated to be 14.33% (95% CI 11.95–17.10%) based on 72 studies, with 9 studies added using the trim-and-fill method to account for publication bias (Table 2). There was substantial heterogeneity across studies (I2 = 99.6%).
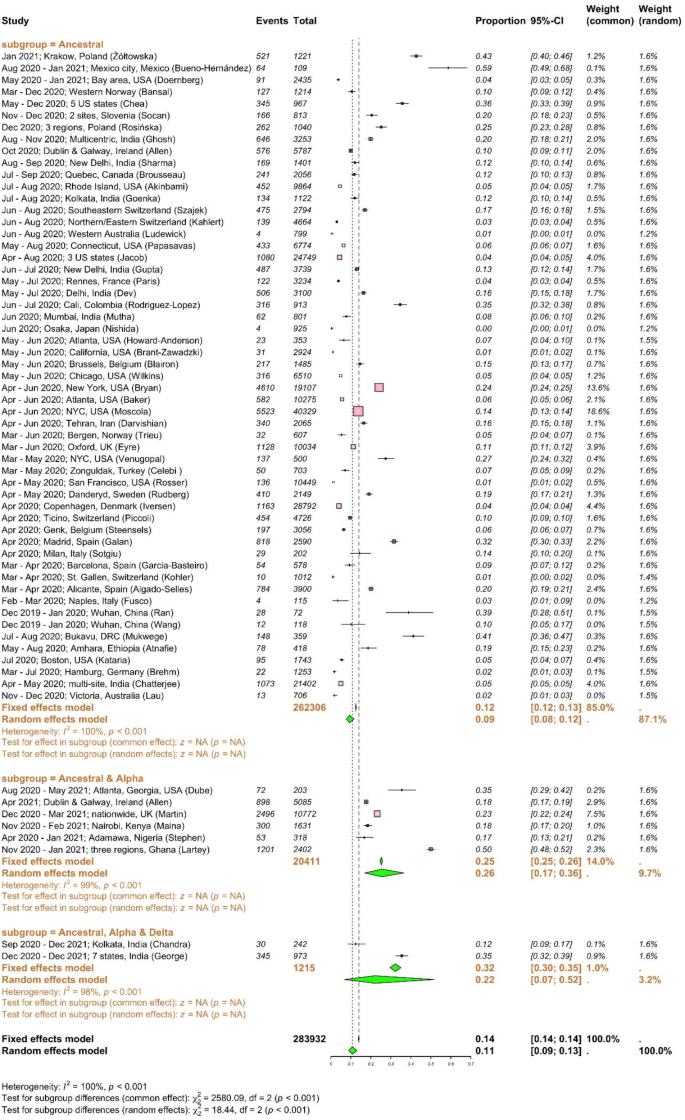
SARS-CoV-2 infection rates among healthcare workers. Meta-analysis of effect estimates was performed using the metaprop function (meta22 package) in R version 4.4.1. We used “Plogit” method or logit transformation for pooling of studies. SARS-CoV-2 infection rates with 95% confidence intervals (CIs) among HCWs were reported from 27 countries, including: Australia, Belgium, Canada, China, Colombia, Denmark, Democratic Republic of the Congo (DRC), Ethiopia, France, Germany, India, Iran, Ireland, Italy, Japan, Kenya, Mexico, Nigeria, Norway, Poland, Slovenia, Spain, Sweden, Switzerland, Turkey, the UK and the USA. Infection rates were plotted against major circulating variants of concerns as sub-group analysis. I2 is a statistic used in meta-analysis to estimate the proportion of total variance in effect sizes due to heterogeneity between studies. Diamonds representing meta-analysis results are printed in green colour and squares representing individual study results are printed in pink colour. A chi-square test (χ2) with degrees of freedom (df) and a p-value was conducted to assess differences between subgroups, indicating whether significant differences exist in the effects across subgroups (p < 0.05).
Occupational exposure to SARS-CoV-2
We deducted data for occupational exposure from 56 studies including 185,712 HCWs (Fig. 3). High-risk occupational exposure for HCWs was defined as direct patient care that likely exposed them to individuals with COVID-19, such as HCWs working in infectious disease wards. Conversely, HCWs with minimal or no contact with COVID-19 cases, like those in the administration or other designated low-risk areas, were considered at low-risk for occupational exposure. The global pooled OR for SARS-CoV-2 infection against high-risk occupational exposure was 1.79 (95% CI 1.49–2.14; high heterogeneity, I2 = 99%) compared to low-risk exposure; meaning that HCWs with high risk of occupational exposure had nearly twice higher odds to be infected with SARS-CoV-2 than HCWs with limited or no occupational exposure. Subgroup analysis based on the major circulating viruses shown that the pooled OR for SARS-CoV-2 infection associated with high-risk occupational exposure was 1.79 (95% CI 1.46–2.19) when the ancestral strain circulated, 1.93 (95% CI 1.27–2.95) when ancestral and alpha strains circulated, and 1.43 (95% CI 0.90–2.28) when ancestral, alpha and delta strains circulated. Low and insignificant heterogeneity was observed within the ancestral, alpha and delta subgroup only. However, the test for VOC subgroup differences indicates that there is no statistically significant subgroup effect (p = 0.62). The ancestral subgroup contributes more studies and participants than other subgroups. We conducted additional subgroup analyses based on geography and study design to explore the heterogeneity among studies assessing occupational exposure to SARS-CoV-2 among HCWs. The ORs by regions were as follows: 1.49 (95% CI 0.97–2.28) in Africa, 1.41 (95% CI 1.05–1.88) in Asia, 1.88 (95% CI 1.54–2.30) in Europe, 2.03 (95% CI 1.29–3.19) in North America, 1.37 (95% CI 0.19–9.80) in Oceania, and 1.40 (95% CI 0.73–2.69) in South America (Supplementary Fig. 5). No significant difference in ORs for occupational exposure by regions was observed. However, the ORs were significantly impacted by study design, where cohort studies (OR 2.10 (95% CI 1.29–3.41)) found higher ORs for occupational exposure than cross-sectional (OR 1.70 (95% CI 1.42–2.04)) and case–control (OR 1.18 (95% CI 1.00–1.40)) studies (Supplementary Fig. 6). Publication bias was implied in both funnel and Doi plots with LFK index of − 2 (Supplementary Fig. 7); however, it could also be indicative of small study effects and/or heterogeneity between studies38,39. The OR of SARS-CoV-2 infection after occupational exposure for HCWs was estimated to be 4.83 (95% CI 3.45–6.75) based on 84 studies, with 28 studies added using the trim-and-fill method to account for publication bias, with a total of 272,364 observations (127,891 exposed and 144,473 control) and 24,203 events. There was high heterogeneity across studies (I2 = 99.0%). In a real-world setting, clinical input would be necessary to determine whether the OR distribution is an important consideration when interpreting this subgroup analysis. Although community infection spread and patient contacts play a key role in occupational exposure, the chance of being infected is influenced by other important work-related factors such as IPC training and practices, PPE use, and working tasks. Hence, this estimate of infection risk for occupational exposure requires further assessment.
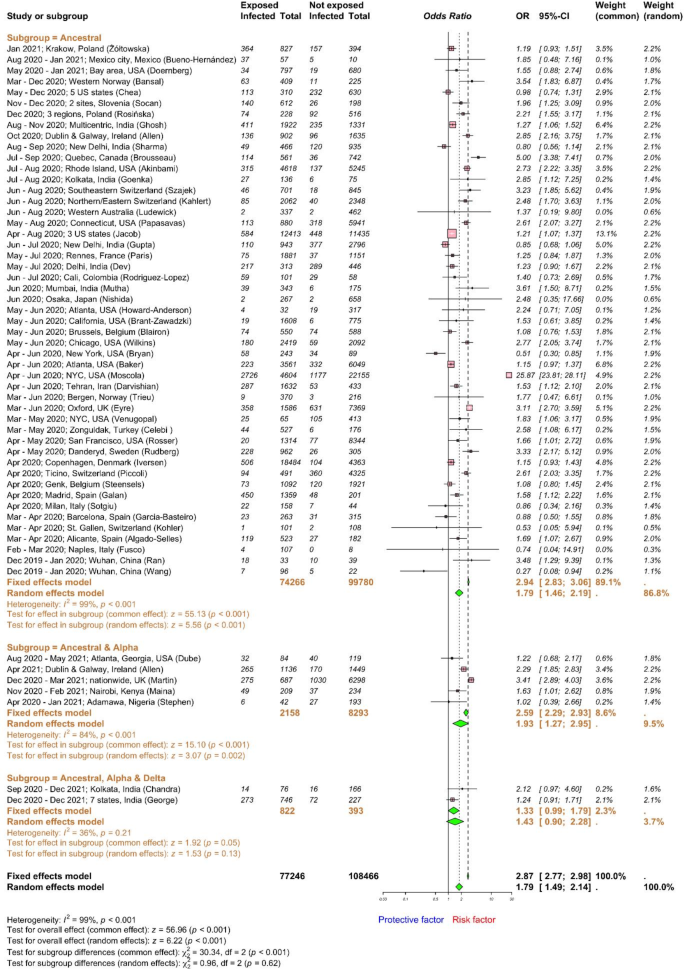
Forest plot to evaluate whether SARS-CoV-2 infection rates differed with occupational exposure to SARS-CoV-2 among healthcare workers. Data are presented as proportions and 95% confidence interval, CI. Meta-analysis of effect estimates was performed using the metabin function (meta22 package) in R version 4. 4.1. Pooling of studies was performed using Mantel–Haenszel method. Diamonds representing meta-analysis results are printed in green colour and squares representing individual study results are printed in pink colour. Forest plot was plotted against major circulating variants of concern as sub-group analysis. I2 is a statistic used in meta-analysis to estimate the proportion of total variance in effect sizes due to heterogeneity between studies. The z-score for the overall combined subgroup effect (common effect) evaluates the pooled effect size across all subgroups, while the z-score for the overall combined subgroup effect (random effects) considers both within-subgroup and between-subgroup variability. A chi-square test (χ2) with degrees of freedom (df) and a p-value was conducted to assess differences between subgroups, indicating whether significant differences exist in the effects across subgroups (p < 0.05).
Work-related factors
In healthcare settings, various occupational practices can pose risk or protect against SARS-CoV-2 infection. The use of PPE, as appropriate, when in contact with patients or performing certain procedures is often included in IPC training for HCWs. In practice, PPE may not be efficiently used. We retrieved data for occupational exposure with insufficient PPE use from 28 studies8,30,31,32,35,37,40,41,42,43,44,45,46,47,48,49,50,51,52,53,54,55,56,57,58,59 including a total of 41,529 HCWs (Fig. 4). In most studies, “insufficient PPE” encompasses two key areas: neglecting to wear PPE as recommended and/or utilising the incorrect or malfunctioning type of PPE for the given hazard. Subgroup analyses according to the major circulating strains revealed that insufficient PPE use was related to higher odds of SARS-CoV-2 infection with OR of 1.60 (95% CI 1.21–2.11) when ancestral strain predominantly circulated, 1.24 (95% CI 0.72–2.14) when ancestral and alpha circulated, and 0.50 (95% CI 0.20–1.24) when ancestral, alpha and delta strains circulated. No statistically significant differences among VOC subgroups were found (p = 0.05). However, it is unlikely to produce clinically useful findings due to the substantial disparity in sample sizes (23,161 HCWs for the ancestral subgroup vs. 5526 HCWs for the ancestral and alpha subgroup and 545 HCWs for the ancestral, alpha, and delta VOC subgroup). To identify key contributors to heterogeneity, we conducted subgroup analyses by geography and study design (Supplementary Figs. 8 and 9). Insufficient PPE use was associated with increased infection odds in Europe (OR 1.95, 95% CI 1.57–2.41) and South America (OR 2.89, 95% CI 1.00–8.42). Associations were less consistent in Africa (OR 1.30, 95% CI 0.70–2.39), Asia (OR 1.21, 95% CI 0.63–2.34), and North America (OR 0.85, 95% CI 0.69–1.04). Cohort studies (OR 2.29, 95% CI 1.34–3.89) showed a stronger association with insufficient PPE use compared to case–control (OR 1.39, 95% CI 0.70–2.78) or cross-sectional studies (OR 1.30, 95% CI 1.00–1.69). The pooled OR for occupational exposure with insufficient PPE use was 1.45 (95% CI 1.14–1.84; I2 = 79%, high heterogeneity). Funnel and Doi plots did not reveal substantial publication bias (LFK index = 0.2; Supplementary Fig. 10) in this meta-analysis. Hospitals often provide IPC training for HCWs. The extent, the duration and the frequency of training vary largely by hospital department and between hospitals, regions, and nations, depending on the availability of resources. During the COVID-19 pandemic, inadequate IPC training encompassed insufficient training in various ways such as depth, duration and resources available. Our meta-analysis showed that the pooled OR for inadequate IPC training was 1.46 (95% CI 1.14–1.87; I2 = 59%, high heterogeneity) for SARS-CoV-2 infection, including data from 6,257 HCWs derived from 7 studies32,33,43,47,50,51,60 (Fig. 5a). Funnel and Doi plots did not reveal substantial publication bias (LFK index = − 0.4; Supplementary Fig. 11). Subgrouping by VOCs was deemed inappropriate due to limited available data while alpha or delta strains were circulating for IPC training and other risk factors evaluated below. Aerosol-generating procedures are generally defined as medical interventions that produce aerosols, potentially increasing the risk of transmission of SARS-CoV-2 among HCWs. Commonly recognised aerosol-generating procedures include intubation and extubation, non-invasive ventilation, tracheotomy, bronchoscopy, sputum induction, open suctioning of airways, high-flow oxygen therapy, and nebulizer therapy61. There was some disagreement on the exact procedure list (e.g., the UK61 or CDC62 guidelines). Among 12 studies assessing infection risk of performing aerosol generating procedures, 8 studies did not specify guidelines31,37,43,46,47,55,63,64 and other four studies used the CDC40,41,58 or Swiss65 guidelines to define aerosol generating procedures, highlighting the need for standardised definitions in research studies. Performing aerosol generating procedures was associated with higher odds (OR 1.36; 95% CI 1.21–1.52; I2 = 24%, low heterogeneity) of SARS-CoV-2 infectivity, including data from 36,804 HCWs extracted from 12 studies37,40,41,43,46,47,55,58,63,65 (Fig. 5b). Despite the anticipated higher risk of infection among HCWs performing these procedures, funnel and Doi plots implied potential publication bias (LFK index = − 3; Supplementary Fig. 11). Using the trim-and-fill method (Table 2), the analysis included 15 studies, with 3 additional studies added, encompassing a total of 38,597 observations (9486 exposed and 29,111 control) and 4469 events. The random effects model yielded an OR of 1.43 (95% CI 1.24 to 1.66), indicating a statistically significant increased risk (z = 4.81, p < 0.0001). Heterogeneity was moderately quantified with I2 of 45.1% (95% CI 0.0%-70.0%).
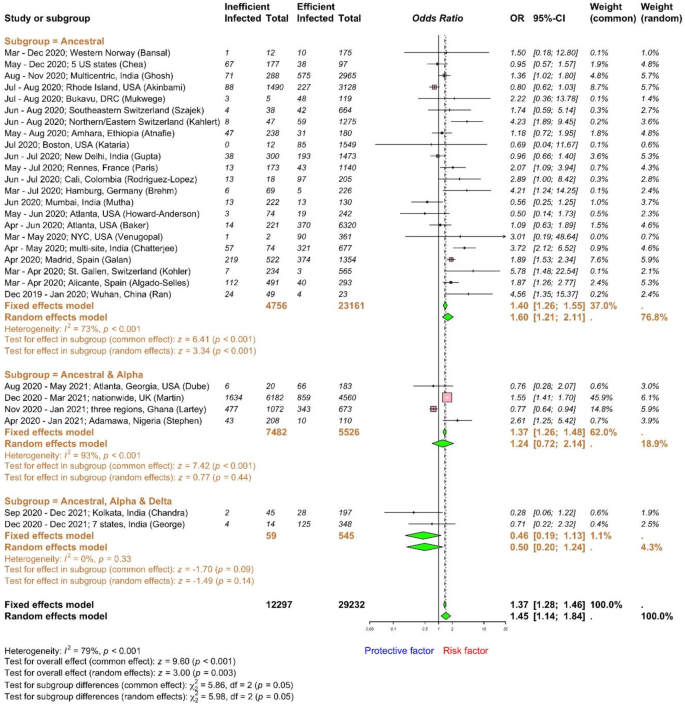
Forest plot to evaluate whether SARS-CoV-2 infection rates differed with personal protective equipment (PPE) use among healthcare workers. Data are presented as odds ratios, ORs, and 95% confidence interval, CI. Meta-analysis of effect estimates was performed using the metabin function (meta22 package) in R version 4. 4.1. Pooling of studies was performed using Mantel–Haenszel method. Diamonds representing meta-analysis results are printed in green colour and squares representing individual study results are printed in pink colour. I2 is a statistic used in meta-analysis to estimate the proportion of total variance in effect sizes due to heterogeneity between studies. The z-score for the overall combined subgroup effect (common effect) evaluates the pooled effect size across all subgroups, while the z-score for the overall combined subgroup effect (random effects) considers both within-subgroup and between-subgroup variability. A chi-square test (χ2) with degrees of freedom (df) and a p-value was conducted to assess differences between subgroups, indicating whether significant differences exist in the effects across subgroups (p < 0.05).
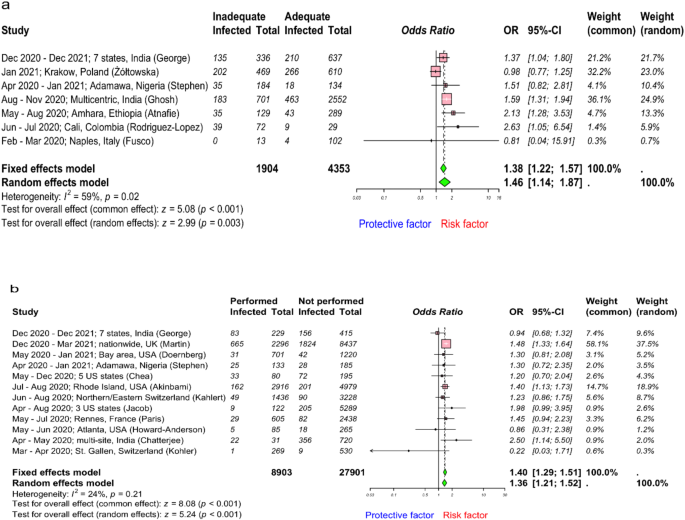
Forest plot to evaluate whether SARS-CoV-2 infection rates differed with infection prevention and control (IPC) training and performing aerosol-generating procedure among healthcare workers. (a) and (b) describes risk assessment following IPC training and performing aerosol-generating procedures respectively. Data are presented as odds ratios, ORs; and 95% confidence interval, CI. Meta-analysis of effect estimates was performed using the metabin function (meta22 package) in R version 4. 4.1. Pooling of studies was performed using Mantel–Haenszel method. Diamonds representing meta-analysis results are printed in green colour and squares representing individual study results are printed in pink colour. I2 is a statistic used in meta-analysis to estimate the proportion of total variance in effect sizes due to heterogeneity between studies.
Environment services and hygiene
Intriguingly, the pooled OR for history of working as a cleaner was 2.72 (95% CI 1.39–5.32; I2 = 84%, high heterogeneity), using data from 10,759 HCWs retrieved from 11 studies8,34,40,58,63,64,66,67,68,69,70 (Fig. 6a). Funnel and Doi plots did not imply publication bias (LFK index = 0.6; Supplementary Fig. 12a,b). We investigated whether frequent decontamination of high touch surfaces was a protective factor against SARS-CoV-2 infection. The pooled OR effect estimates for frequent decontamination of high touch surfaces was 0.52 (95% CI 0.42–0.64; I2 = 0%, low heterogeneity) from 2163 HCWs (Fig. 6b). Potential publication bias was implied in both funnel and Doi plots (LFK index = 4; Supplementary Fig. 12c,d), although this analysis included only two studies51,53. In addition, hand hygiene is an important protective factor against infections. However, hand hygiene practices are often in reality not optimal. We included data on inadequate hand hygiene as a risk factor for SARS-CoV-2 infection from 10 studies32,33,43,45,47,49,51,53,57,71 involving a total of 9,488 HCWs. The evaluation of hand hygiene practices differed across studies, with some adhering to the national or global72 guidelines and others relying on single-question surveys such as consistency of hand washing. Nevertheless, we found that HCWs with inadequate hand hygiene practices had higher odds of being infected with SARS-CoV-2 (pooled OR 1.17; 95% CI 0.79–1.73; I2 = 63%, high heterogeneity) than those with good hand hygiene practices (Fig. 6c). These results are imprecise with wide CIs, and potential publication bias was implied in both funnel and Doi plots (LFK index = 6; Supplementary Fig. 12e,f); however, it could also be contributed by small study effects and/or between studies heterogeneity38,39. The trim-and-fill method included 13 studies, with 3 additional studies, comprising a total of 11,700 observations (1892 exposed and 9808 control) and 2653 events. The random effects model yielded an OR of 0.96 (95% CI 0.60–1.52) (Table 2), indicating no significant association (p = 0.8476), although heterogeneity was high (I2 = 66.2% (95% CI 39.2–81.2%)).
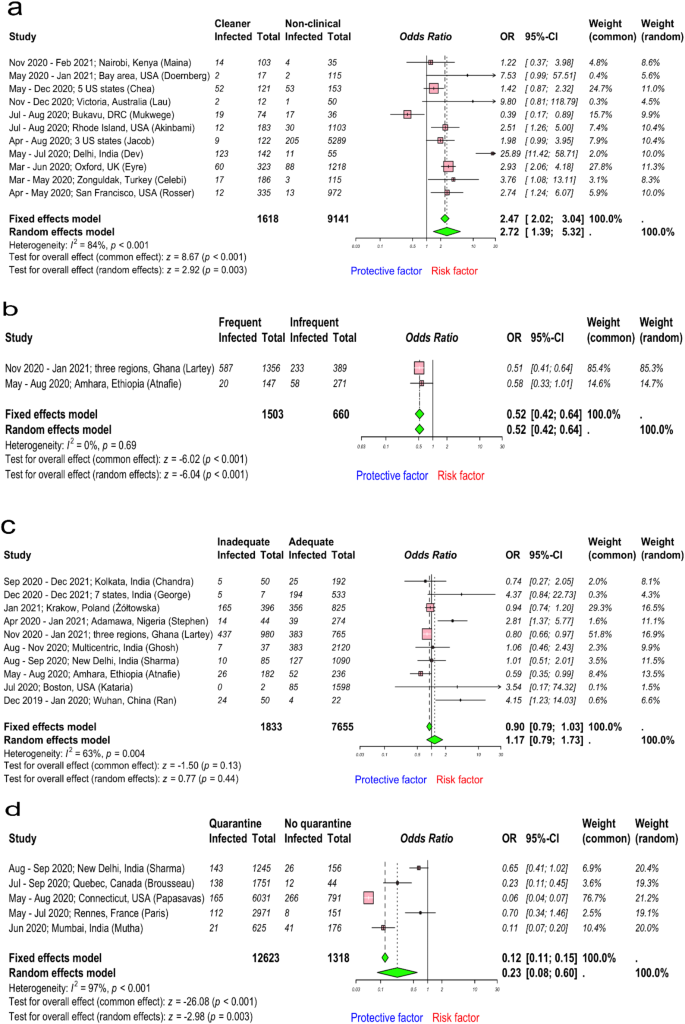
Forest plot to evaluate whether SARS-CoV-2 infection rates differed with job profile as cleaner, frequent decontamination of high touch areas, hand hygiene, and quarantine among healthcare workers. (a–d) describes risk assessment following job profile (as cleaner), frequent decontamination of high touch areas, hand hygiene, and history of quarantine. Data are presented as odds ratios, ORs; and 95% confidence interval, CI. Meta-analysis of effect estimates was performed using the metabin function (meta22 package) in R version 4. 4.1. Pooling of studies was performed using Mantel–Haenszel method. Diamonds representing meta-analysis results are printed in green colour and squares representing individual study results are printed in pink colour. I2 is a statistic used in meta-analysis to estimate the proportion of total variance in effect sizes due to heterogeneity between studies.
Quarantine
We extracted data from 5 studies54,55,71,73,74 investigating the history of quarantine as a risk factor for SARS-CoV-2 infection. HCWs with a history of quarantine were removed from work because of a close contact with a COVID-19 case. However, one study73 quarantined HCWs who suffered from COVID-19 like illness, which might influence the results, and this situation is more accurately described as isolation than quarantine. It reflects a different risk profile and prior probability of SARS-CoV-2 infection compared to asymptomatic individuals who are removed from work based on contact tracing. Data from a total of 13,941 HCWs was included in this analysis. We found the pooled OR for history of quarantine was 0.23 (95% CI 0.08–0.60; I2 = 97%) against SARS-CoV-2 infection, suggesting that HCWs with a history of quarantine were protected against SARS-CoV-2 infection when returning to work (Fig. 6d). Although funnel and Doi plots indicated potential publication bias (LFK index = 5; Supplementary Fig. 12g,h), asymmetric plots could be due to heterogeneity or limited number of included studies38,39. The trim-and-fill method analysis included 8 studies, with 3 additional studies, comprising a total of 20,259 observations (18,590 exposed and 1669 control) and 1371 events. The random effects model yielded an OR of 0.07 (95% CI 0.02 to 0.25) (Table 2), indicating a significantly reduced risk (p < 0.0001). Heterogeneity was high, I2 of 97.9% (95% CI 97.0–98.5%). Data was not available with circulating alpha/delta variants or for how long the HCWs were in quarantine or how long they had been back at work before the data was collected.
Household exposure to SARS-CoV-2
Available data was retrieved from 15 studies37,40,49,52,53,54,55,65,69,70,75,76,77 including 54,796 HCWs and the pooled OR calculated (Fig. 7). We found that the odds of being infected with SARS-CoV-2 were much higher (OR 7.07; 95% CI 3.93–12.73; I2 = 97%, high heterogeneity) for HCWs with household exposure to SARS-CoV-2 than without. Therefore, HCWs who were exposed to SARS-CoV-2 within their household had 7 times more odds to be infected with SARS-CoV-2 than without. This highlights the importance of strengthening IPC practices, both at home and at work. Additionally, potential publication bias was implied in both funnel and Doi plots (LFK index = 3; Supplementary Fig. 13). However, any visual imbalance in the funnel plot and false positive LFK index could also result from true heterogeneity rather than only publication bias38,39. The trim-and-fill method included 22 studies, with 7 additional studies, encompassing a total of 80,301 observations (3709 exposed and 76,592 control) and 5364 events. The random effects model indicated a significantly increased risk with an OR of 2.76 (95% CI 1.24–6.14), supported by a p-value of 0.0128. Heterogeneity was high, I2 of 98.0% (95% CI 97.6–98.4%).
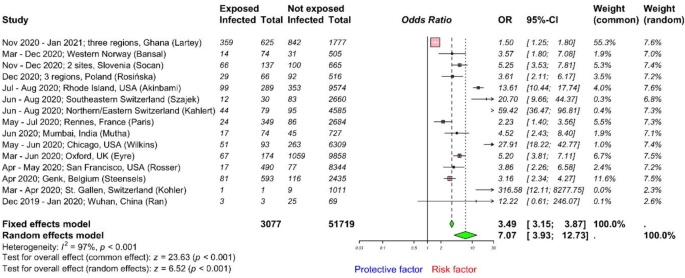
Forest plot to evaluate whether SARS-CoV-2 infection rates differed with household exposure to SARS-CoV-2 among healthcare workers. Data are presented as odds ratios, ORs; and 95% confidence interval, CI. Meta-analysis of effect estimates was performed using the metabin function (meta22 package) in R version 4. 4.1. Pooling of studies was performed using Mantel–Haenszel method. Diamonds representing meta-analysis results are printed in green colour and squares representing individual study results are printed in pink colour. I2 is a statistic used in meta-analysis to estimate the proportion of total variance in effect sizes due to heterogeneity between studies.
Biases and sensitivity analyses
Some of funnel and Doi plots implied potential publication bias (except meta-analyses assessing the role of inadequate IPC training, insufficient PPE use, and working as a cleaner). Nevertheless, these plots might also report false positive results due to between-study heterogeneity, number and size of studies, rather than publication bias alone38,39. Estimates from random-effects models may be more appropriate, as they account for potential heterogeneity between studies. Fixed-effects could be considered, where there is low heterogeneity (such as performed aerosol-generating procedures and frequent decontamination); however, overall results of both models in such cases were similar. Furthermore, we evaluated the potential for bias in each estimate arising from several sources using ROBINS-E and robvis tools21. These include confounding variables, measurement errors in exposure or risk factor classification, selection bias, interventions after exposure (e.g., vaccination), missing data, outcome measurement errors (e.g., PCR and serology tests), and reporting bias. Risk of bias assessment was conducted by two independent reviewers. We then assigned each study an overall risk-of-bias rating (low, some concerns, high, and very high) based on the domain and the estimate judged to have the highest risk of bias. We found that 24 studies had low concerns and 39 had some concerns (Supplementary Fig. 1). As no individual study was rated as having high concerns for bias, sensitivity analysis was not deemed necessary.

